1. Problem background
Fault simulation is an important step in chip testing and an important part of the test vector generation system (ATPG) and fault diagnosis. It is mainly used to simulate the behavior of the faulty circuit and evaluate the test vector's ability to detect possible faults within the circuit. Simply put, fault simulation is to determine whether the fault under test can be detected by comparing the logic simulation results of a fault-free circuit and a faulty circuit under a specific test vector.
During the manufacturing process of chips, they are inevitably affected by various uncontrollable factors, resulting in various defects in the manufactured chips. For defects that exist inside the chip, in order to detect defects using automated methods such as fault simulation and to quantify the quality of defect detection, defects are usually abstracted into various fault models, such as stuck-at fault, transition delay fault, path delay fault, etc. Among them, the most commonly used fault model is fixed fault. As shown in Figure 1, assume that the input node b of the AND gate has a stuck-at-1 (abbreviated SA1) fault. When we apply excitations to nodes a and b at the same time (a=1, b=0), the expected output of node c is "0", but due to the existence of this fault, the actual output of node c is "1", which means that the SA1 fault at node b is detected by the test vector (a=1, b=0). This is a simple process of fault simulation.
Function vector is a type of test vector. It is a vector generated under the functional operating conditions of the circuit. It is used to test the internal state of the circuit and detect possible manufacturing defects in the circuit. Different from structural test vectors (also called scan vectors), functional vectors are essentially timing vectors, with different vector input values on different clock cycles of the time axis, and the logic state of the internal nodes of the circuit depends on the simulation results input in previous clock cycles. This also means that for fault simulation of functional vectors, the bit-parallel methods commonly used for structural test vector simulation cannot be used. At the same time, the function vector may cover the circuit operation process of tens of thousands or even millions of clock cycles, which also makes fault simulation for the function vector very time-consuming.
This question is aimed at single fixed faults in gate-level sequential circuits. Function vectors are used for fault simulation. The participating teams are required to select appropriate algorithms and use performance optimization methods such as parallel simulation as much as possible to provide high-performance functional safety assessment. Figure 2 shows a simple flow diagram of gate-level fault simulation of function vectors.
2. Problem description
2.1 Description
This question requires participating teams to combine their understanding of function vectors and fault simulation to design a C++ program. The program should be able to read the gate-level netlist, ATPG library, fault list, function vector and other files provided by the problem party, and complete the fault simulation of the function vector by correctly parsing and processing the files. The program output is a list of detected faults and a list of undetected faults.
Among them, participating teams need to complete the following points:
(1) Correctly read the netlist file and combine it with ATPG
library information, convert the standard cell netlist into a netlist structure suitable for simulation.
(2) Correctly read the fault list file, combine the fault list information, and insert the corresponding fault at the correct position in the netlist.
(3) Correctly read the function vector file to obtain the excitation of the corresponding input node and the expected response of the output node.
(4) Carry out logic simulation of the fault-free circuit and obtain the fault-free simulation value of the internal node of the circuit at the corresponding clock node.
(5) Carry out fault simulation, measure the actual response of the circuit output node at the corresponding clock node, and determine whether the fault can be detected by the current function vector based on the comparison between the expected response and the actual response.
(6) According to the results of fault simulation, the detected fault list and the undetected fault list are output respectively.
This problem allows participating teams to use multi-threading for parallel acceleration based on the specific needs of the algorithm. Considering that the development hardware environments of participating teams are inconsistent, for the sake of fairness, this question limits the maximum number of threads used to 4.
2.2 Problem Case
The problem co-creator provides the problem case to the participating teams with procedures for verifying and optimizing the design. The following is a simple example of the provided file.
(1) Verilog planar netlist
The flat netlist consists of a module, which defines the input nodes, output nodes, instantiated standard cells and other information of the circuit. The co-creator of the problem provides the participating teams with an open source Verilog netlist parser for their reference, and also allows the participating teams to use their own developed parser.
Figure 3 gives an example.
(2)ATPG library
The ATPG library provided in this question uses JSON (JavaScript Object Notation) format. JSON is a simple data exchange format that has proven to be useful and simple enough. For example, an AOI unit is represented in the following way, and other units are also represented using the same structure.
Figure 4 shows an example of the JSON description of ATPG library. Each standard unit contains 3 attributes: name, signals and sim_primitives.
name: array form, containing multiple unit names with the same logical function but different driving capabilities;
signals: contains three types of signals, input, output and wire;
sim_primitives: One or more custom units. Each custom unit includes two attributes, sim_type and connection, which respectively represent the type and connection relationship of the unit. The first signal in connection is the output, and the rest are inputs.
(3)Fault list
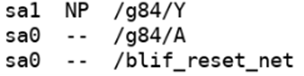
The format of the fault list is very simple, and only contains the fault type (sa0 or sa1), fault detection status (NP, DT, ND or --, where NP means not analyzed, DT means detected, ND means not detected, - means that the current fault is equivalent to the above fault. In the input fault list, all faults are in the NP state) and fault location (the instantiation name of the standard unit and the corresponding pin name).
Figure 5 shows a simple example, which contains three faults, located at the Y pin and A pin of the instantiated standard unit g84, and the circuit input node blif_reset_net, and these three faults are equivalent faults.
(4) Function vector
The function vector of this problem adopts VCD (Value
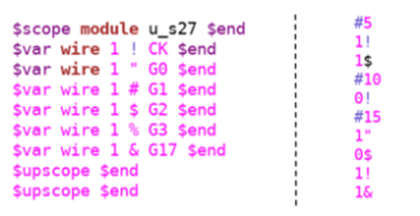
Change Dump) file format. The VCD file is a standard waveform file. It is used in digital circuit simulation to record changes in signal values of designated circuit nodes and records the information of the entire simulation. It should be noted that for fault simulation of function vectors, if the clock nodes that measure the signal simulation values are different, the detected faults may be different. In order to ensure the consistency of results, participating teams are required to detect faults in the following ways: When the simulation value of a circuit input node changes, measure and compare the simulation value of the circuit output node once, and use the comparison result to determine whether the fault has been detected.
The example in Figure 6 is an excerpt from a VCD file. It is necessary to measure the simulation values of the circuit output node at 5ns, 10ns, and 15ns respectively and make comparisons. For the format description of VCD files, please refer directly to its standard definition file.
2.3 Output files
This question requires the participating team's program to output two files after completing the fault simulation, one to store the list of detected faults, and the other to store the list of undetected faults. The format of the output file should be consistent with the format of the fault list in the problem case provided by the problem co-creator.
2.4 Environment
It is recommended that participating teams use a C++ version compatible with C++20 for their development environment and operating environment, and develop under a Linux system environment. The reference software environment is given below.
• gcc 10.3.0
• g++ 10.3.0
• cmake 3.13.4
3. Scoring criteria
The co-creator of the problem has prepared test cases for this problem, and will select and provide some of the test cases to participating teams to evaluate the quality of the algorithm; the remaining cases are only for scoring purposes and will not be open to participating teams.
Test scoring: Each test case is scored independently and follows the same scoring criteria.
(1) The fault detection results of this problem are based on the results of commercial EDA tools as the golden results. If the results output by the participating teams are different from the golden results, the fault detection with differences will be considered to have failed. For each differentiated fault that occurs (an equivalent fault is calculated as one fault), 0.01 points will be added to the score. When the number of faults with differences exceeds 100 or exceeds 1% of the total fault list, it is considered that the participating team failed to simulate the fault of the current case, and the score in this case is n (n is the number of participating teams).
(2) If the case passes condition (1), assuming there are n participating teams, they will be sorted according to the total running time of the program. The first place will be worth 1 point, the second place will be worth 2 points, and so on, and the last place will be worth n points. In addition, an upper limit of 2 hours is set for the running time of a single test case. If it exceeds 2 hours, the running of the program will be terminated, and the participating team will be considered to have failed the fault simulation of the current case, and the score in this case will be n.
(3) When the case passes condition (1), if there is a case where the running time is the same, the scores will be scored according to the rule of the same score and increasing ranking. For example, if two teams have the same running time and both complete the fault simulation the fastest, then these two teams will be awarded 1 point, and the third team will be awarded 3 points.
After each case in the scored case set is scored, the total score is the weighted sum of the individual case scores, where the weight coefficient of an individual case is positively related to the size of the case. The team with the lower total score will be ranked higher.
Other ratings: design document quality, open source code standardization, etc.